
Press Release
NaaS and Cloud Networking to Add $36B by 2031, as 62% of Enterprises Move NaaS Into Production or Evaluation

Futurum Research’s 2H 2026 Networking Market Sizing & Five-Year Forecast projects the global market at $354.9B by CY2031, while its Decision Maker Survey (N=800) finds 62% of enterprises have NaaS in production, evaluation, or planned evaluation.
Cite this

Austin, Texas, USA, August 24, 2026
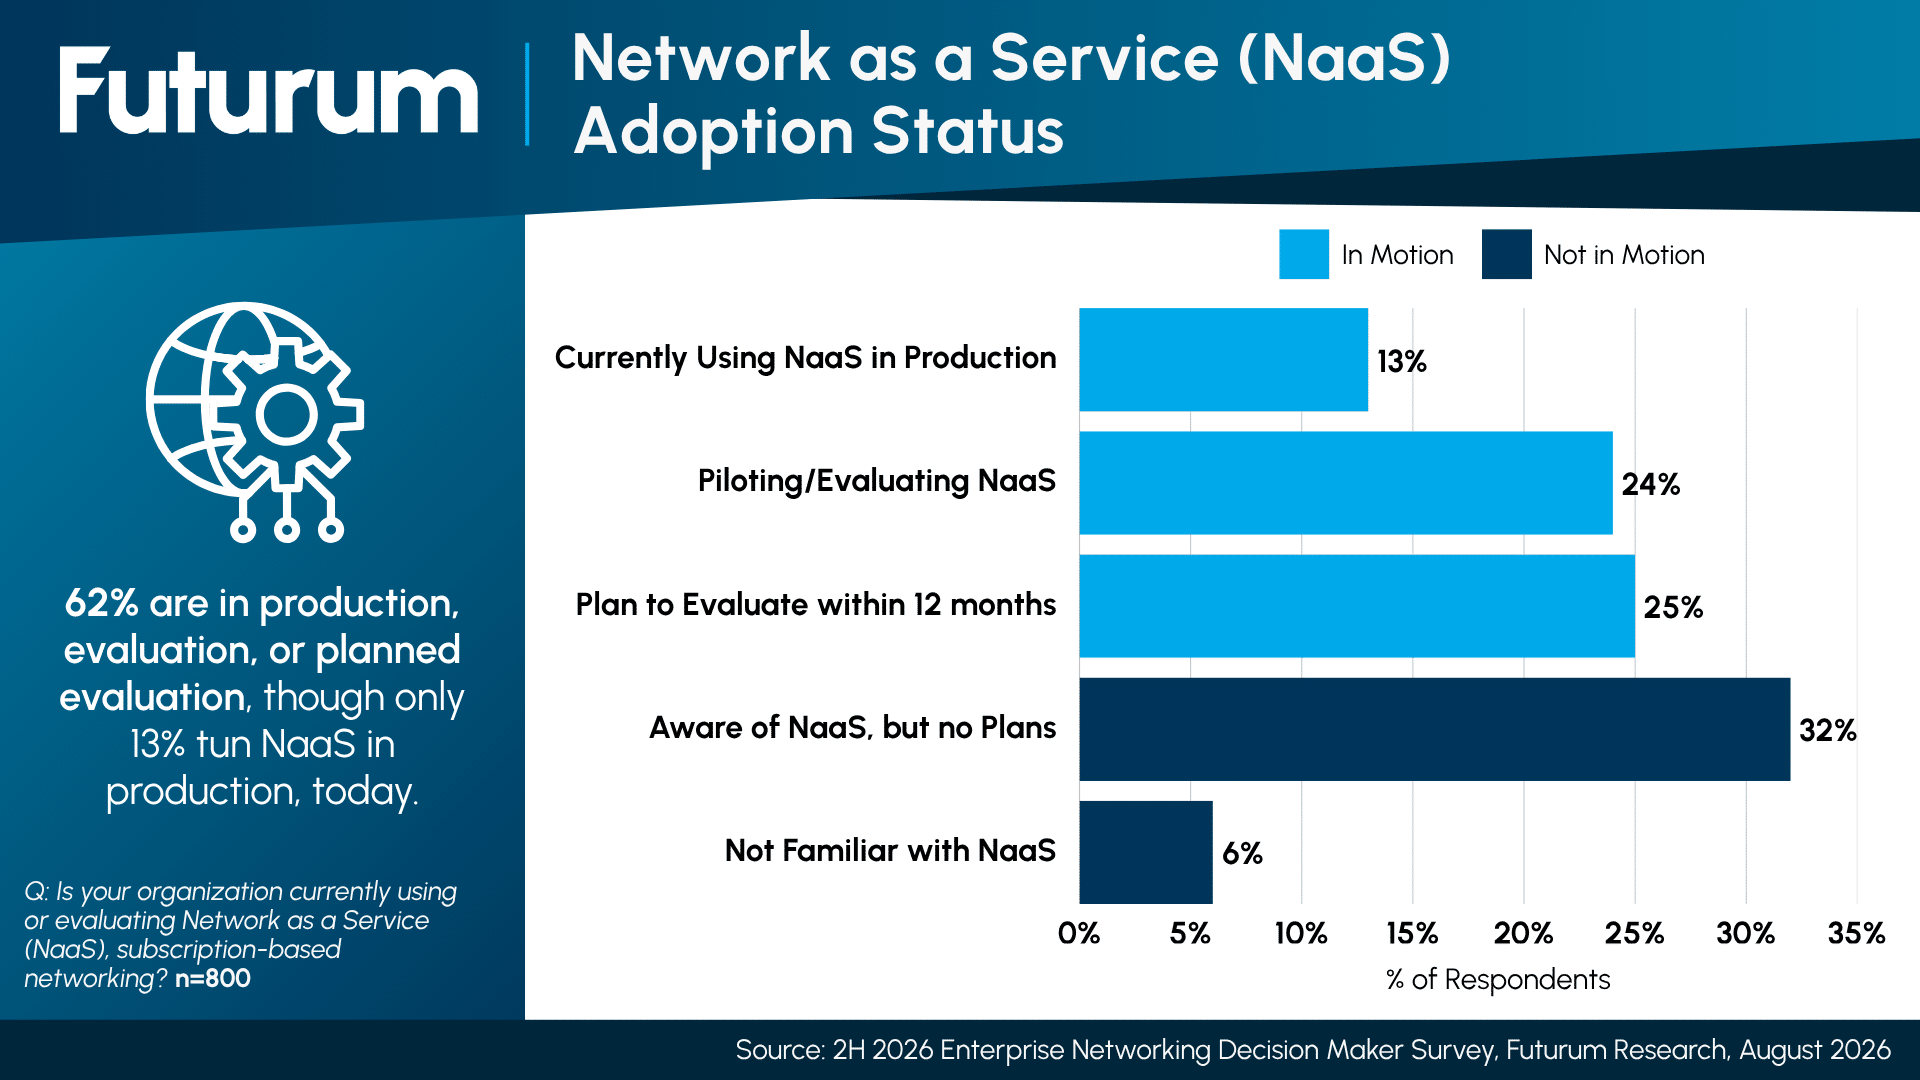
According to Futurum Research’s newly released 2H 2026 Networking Market Sizing & Five-Year Forecast and the companion 2H 2026 Enterprise Networking Decision Maker Survey (N=800 enterprise networking decision makers globally with authority over or influence on networking vendor selection), the global enterprise networking market compounds from $233.1B in CY2025 to $354.9B by CY2031, a 7.26% CAGR under the Base case across 13 submarkets. Within that total, NaaS and Cloud Networking together add $36.0B between CY2025 and CY2031, more than the $30.1B added by Data Center Networking on its own. On the demand side, 62% of surveyed enterprises are already running NaaS in production, piloting or evaluating it, or planning to evaluate it within 12 months, even though only 13% have it in production today.
Figure 1: Absolute Revenue Added by Networking Submarket, CY2025 to CY2031
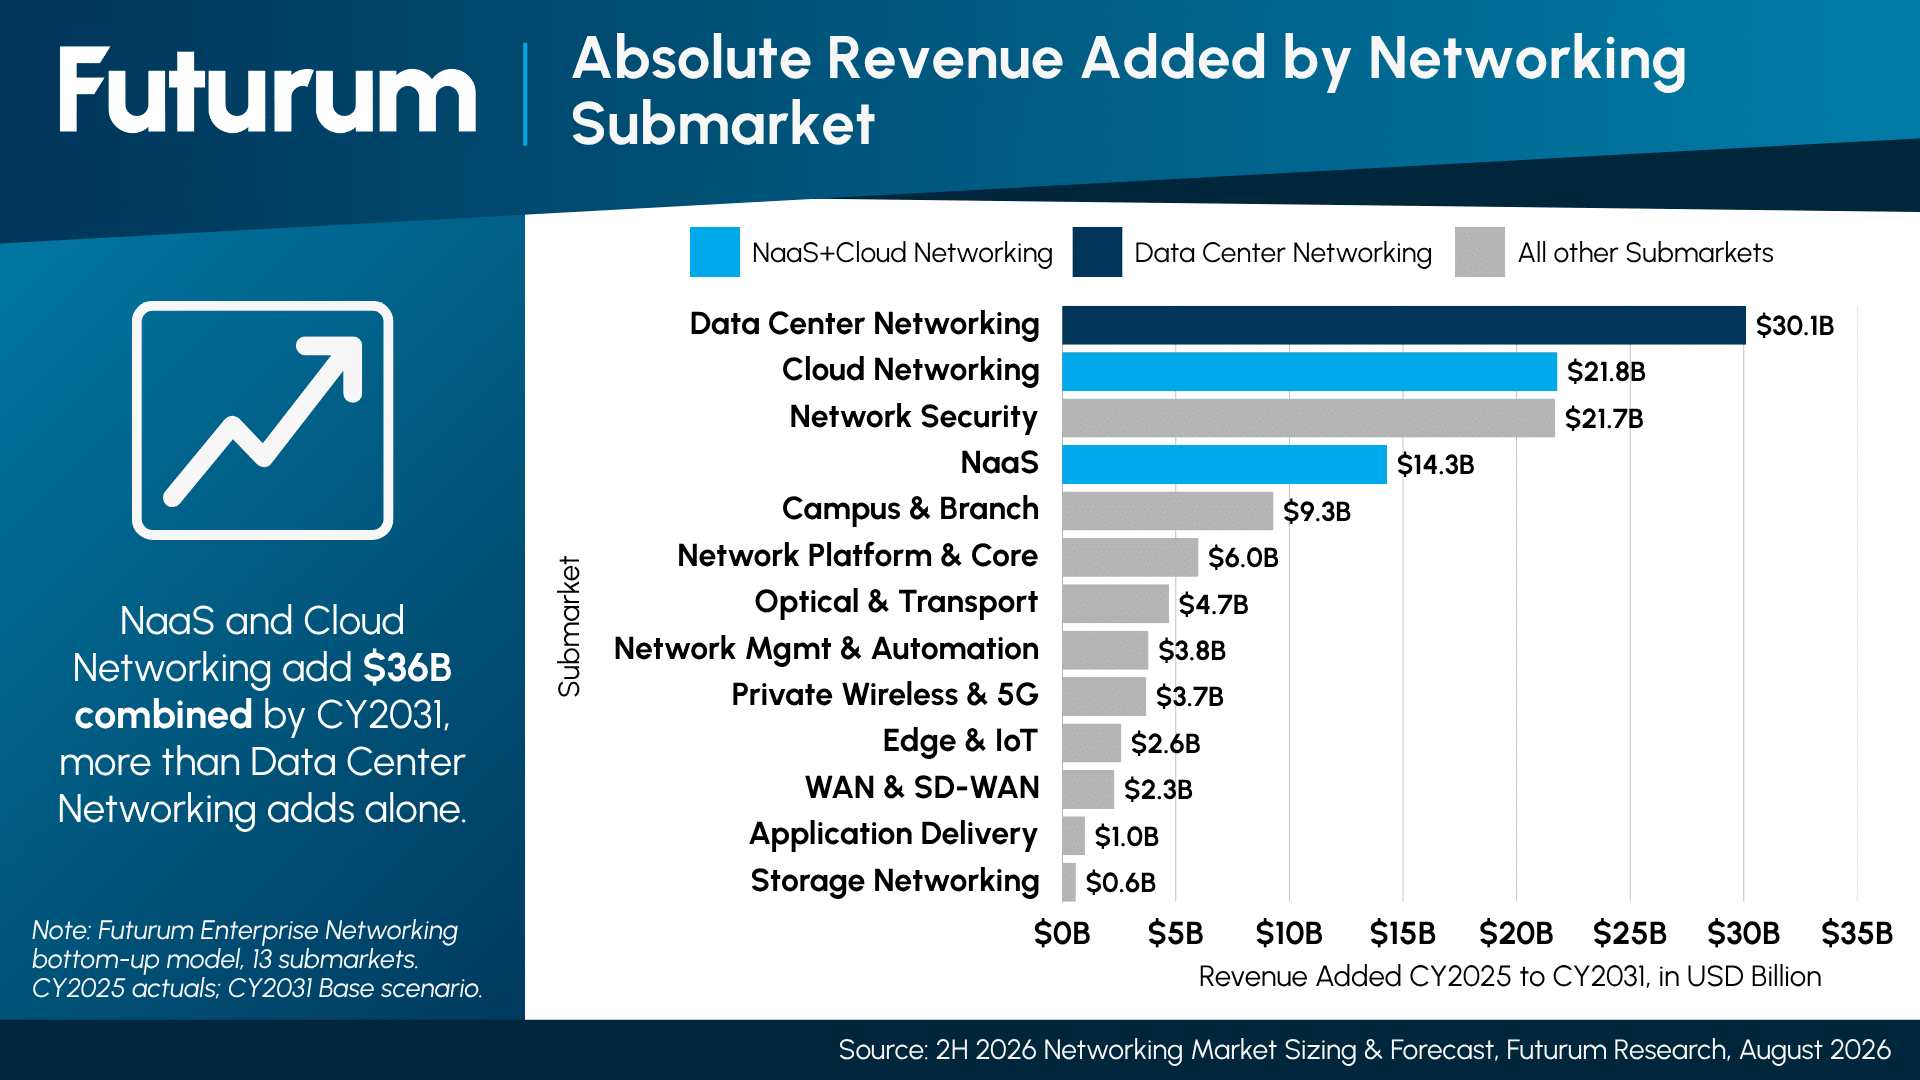
Figure 2: Network as a Service (NaaS) Adoption Status
“The question in networking is not how much AI hardware ships. It is who owns the equipment when the refresh comes due. Data Center Networking is the largest engine in this forecast, and it grows through expansion, with 43% of buyers planning a significant increase in spend on infrastructure they already run. NaaS grows differently: by converting estates that enterprises no longer own, and 62% of them are already in production, evaluation, or planned evaluation. Those are different sales motions, and they sit on different balance sheets. Vendors that treat consumption as a pricing page bolted onto a hardware business will lose this to the ones that can carry the asset, the lifecycle, and the residual risk themselves.”— Tom Hollingsworth, Research Director, Networking, The Futurum Group
The forecast and the survey together point to several structural shifts in enterprise networking through CY2031:
- Data Center Networking leads on dollars added and on spend intent. It adds the most absolute dollars of any submarket, moving from $47.4B in CY2025 to $77.5B by CY2031 at an 8.53% CAGR, and 43% of enterprises plan a significant increase in data-center networking spend, the top area ahead of network management and automation at 39%. Today, the wallet still tilts toward Campus and Branch at 22% of spend against Data Center at 13%, so the reallocation is underway but not yet complete.
- NaaS is a small wallet with an outsized pipeline. NaaS already accounts for a mean 14% of the enterprise infrastructure estate, yet only 13% of enterprises run it in production, and 62% are in production, evaluation, or planned evaluation. The submarket compounds at 11.92% from $14.8B to $29.0B by CY2031, the second-fastest rate of the 13 submarkets.
- The scenario range is $131.6B wide by CY2031. The Bull case reaches $421.1B at a 10.36% CAGR and the Bear case $289.4B at 3.68%, and even the Bear case is a slowdown rather than a contraction, still adding $56.4B over the six years. The swing depends on whether the AI buildout runs without a digestion year and whether the consumption-led submarkets convert their pipelines on schedule.
Subscribers can read more in the full reports, “2H 2026 Networking Market Sizing & Five-Year Forecast” and the “2H 2026 Enterprise Networking Global Enterprise Decision Maker Survey Report,” on the Futurum Intelligence Platform. Non-subscribers click here for more information.
About Futurum Intelligence for Market Leaders
Futurum Intelligence’s Networking IQ service provides actionable insight from analysts, reports, and interactive visualization datasets, helping leaders drive their organizations through transformation and business growth. Subscribers can log into the platform at https://app.futurumgroup.com/, and non-subscribers can find additional information at Futurum Intelligence.
Follow news and updates from Futurum on X and LinkedIn using #Futurum. Visit the Futurum Newsroom for more information and insights.
Other Insights From Futurum:
WidePoint’s Strong Q2 Results Signal Growth Amid Cybersecurity Demand
Infoblox’s New Leadership: A Strategic Move for Global Growth?
Bell’s AI-Powered Spoofing Detection: A Major Shift for Phone Fraud Prevention?